|
Weather Eye with |
The following data sets and comments are from the climate4you.com website developed by Professor Ole Humlum who is a Danish Professor Emeritus of Physical Geography at the University of Oslo, and Adjunct Professor of Physical Geography at the University Centre in Svalbard.
The website climate4you.com which he edits endeavours to provide an ongoing climate data website which is updated monthly.
Several of the temperature diagrams on this site begin in the year 1979, where the fine satellite record begins. This is chosen as a general start date to make comparison between different data sources (satellite, surface, etc.) easy. On the other hand, this approach may conceal the fact that Earth's climate record is much longer. It is the purpose of the present short paragraph to introduce modern climate change to this longer time perspective.
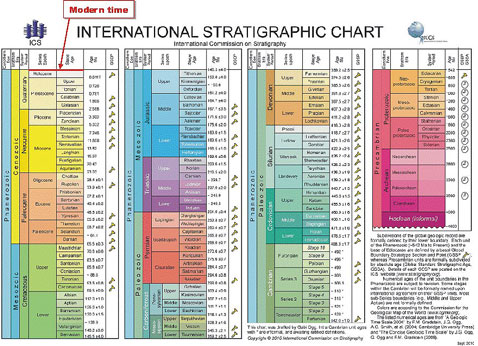
Fig.1. Geological stratigraphic chart for the entire geological history of planet Earth. Modern time is indicated by the thin red line at the top of the left column. Please note that the time scale is highly compressed, and increasing so towards higher ages. The left hand column fits on top of the next column to the right, column no 2 on top of no 3, and the right hand column should be at the bottom.
Planet Earth has an age of about 4600 million years. The diagram above (Subcommission for Stratigraphic Information) shows a geological stratigraphic chart for the entire geological history, subdivided into a vast number of epochs, each consisting of a number of stages. Most (if not all) of these geological divisions are based on the recognition of environmental changes affecting the entire planet; that is, past global climate changes. In other words, global climate change has been the rule for the entire history of Earth, not the exception.
If each year in the time scale above (Fig.1) was represented by one millimetre, the entire stratigraphic chart would be about 4600 km (2858 miles) long. In Europe, this corresponds roughly to the distance between Madrid (Spain) to Sverdlovsk in the Ural Mountains (Russia). In North America 4600 km roughly corresponds to the distance between San Francisco (USA) and Quebec (Canada). On this scale modern humans would appear within the last 200 m, the Polar Bear within the last 150 m, and the entire global meteorological record since about 1850 would take up the last 16 cm. The period with satellite observations would fit into the final 3 cm.
From time to time the planet has been affected by millions of years with relatively cold climate, each such period leading to a long succession of glacial and interglacial periods. During the last couple of millions of years, planet Earth has been in such a cold stage. The last (until now) ice age ended around 11,600 years ago, and we are for the time living in a so-called interglacial period, until the next ice age will begin some time into the future.
The last four glacial periods and interglacial periods are shown in the diagram below (Fig.2), covering the last 420,000 years in Earth's climatic history.
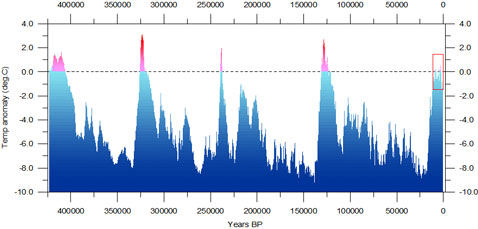
Fig.2. Reconstructed global temperature over the past 420,000 years based on the Vostok ice core from the Antarctica (Petit et al. 2001). The record spans over four glacial periods and five interglacials, including the present. The horizontal line indicates the modern temperature. The red square to the right indicates the time interval shown in greater detail in the following figure.
The diagram above (Fig.2) shows a reconstruction of global temperature based on ice core analysis from the Antarctica. The present interglacial period (the Holocene) is seen to the right (red square). The preceding four interglacials are seen at about 125,000, 280,000, 325,000 and 415,000 years before now, with much longer glacial periods in between. All four previous interglacials are seen to be warmer (1-3oC) than the present. The typical length of a glacial period is about 100,000 years, while an interglacial period typical lasts for about 10-15,000 years. The present interglacial period has now lasted about 11,600 years.
According to ice core analysis, the atmospheric CO2 concentrations during all four prior interglacials never rose above approximately 290 ppm; whereas the atmospheric CO2 concentration today stands above 400 ppm (by volume or molecular fraction, as of 2018). The present interglacial is about 2oC colder than the previous interglacial, even though the atmospheric CO2 concentration now is about 100 ppm higher.
The last 11,000 years (red square in diagram above) of this climatic development is shown in greater detail in the diagram below (Fig.3), representing the main part of the present interglacial period.
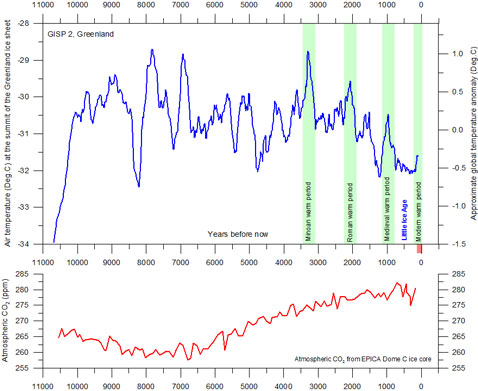
Fig.3. The upper panel shows the air temperature at the summit of the Greenland Ice Sheet, reconstructed by Alley (2000) from GISP2 ice core data. The time scale shows years before modern time. The rapid temperature rise to the left indicate the final part of the even more pronounced temperature increase following the last ice age. The temperature scale at the right hand side of the upper panel suggests a very approximate comparison with the global average temperature (see comment below). The GISP2 record ends around 1854, and the two graphs therefore ends here. There has since been an temperature increase to about the same level as during the Medieval Warm Period and to about 395 ppm for CO2. The small reddish bar in the lower right indicate the extension of the longest global temperature record (since 1850), based on meteorological observations (HadCRUT3). The lower panel shows the past atmospheric CO2 content, as found from the EPICA Dome C Ice Core in the Antarctic (Monnin et al. 2004). The Dome C atmospheric CO2 record ends in the year 1777.
********************************************************
For further information on a range of weather and climate matters see my recent book "Climate Change: A Realistic Perspective.. The fall of the weather dice and the butterfly effect." Amazon