|
Weather Eye with |
Rainfalls for the month of March have been recorded in Tauranga for 125 years since 1898 – except for 1904, 1908 and 1909.
This graph below shows the range of rainfalls from a high of 504 mm in 1979, to a low of 5 mm in 1943.
The second wettest March was in 1972, when 318 mm was recorded, and two March months – 1921 and 2010 – recorded 14 mm.
The long-term average rainfall for Tauranga for March is 109 mm. The rainfall for March 2024 was 53 mm.
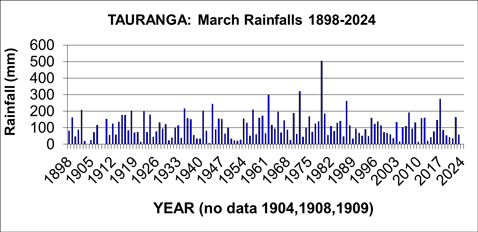
The graph shows no significant overall trend in rainfalls in March during the last 125 years, apart from a small increase in the average rainfall for the 50 years ending in 1960 of 103 mm, compared with 117 mm in the 50 years to 2010.
Since 1898, there have been twelve March months with a rainfall of 200 mm or more, and eleven March months with a rainfall of 30 mm or less.
The wettest March months in chronological order are: 1902,1918,1922,1935,1941,1944,1957,1962,1972,1979, 1987 and 2017.
The driest March months in chronological order are: 1903,1905,1921,1943,1951,1952,1953,1969, 2004, 2010 and 2013.
***************
Temperatures 1913-2024
Temperatures have been recorded in the Tauranga area at several sites during the last 110 years including the current Tauranga Airport site from June 1990.
The graph shows details of the average daily maximum temperatures, called simply ‘afternoon', for Tauranga for the months of March from 1913-2024.
March 1947 is not included because of incomplete data.
The average daily maximum temperature for March 2024 was 22.1 degrees Celsius.
The long-term average afternoon temperature in March for Tauranga is 22.5 degrees Celsius, ranging from the cool March months of 1960 with an average afternoon temperature of 20.4 degrees Celsius, and 1940 with an average afternoon temperature of 20.8 degrees Celsius, to the warm March months of 1916 (24.7 degrees Celsius), and 1938 and 1968 (24.6 degrees Celsius).
It is very common for areas such as Tauranga to have had different observation sites during the years; and the readings from the earlier sites have to be adjusted to the present site using ‘standard climatological procedures'.
It's considered the temperature series described here is a fair and true record of what the temperature would have been if the current observation site (Tauranga Airport) had been used throughout the period.
It's important to note that in considering ‘climate change', the methodology used in computing an 'official' set of climate observations is very important – as otherwise erroneous conclusions may be drawn.
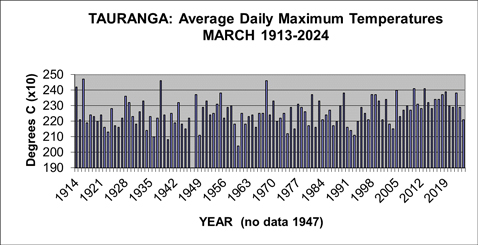
The graph of the average afternoon temperatures for March shows generally normal variations from March to March but with some warming over the last 20 years .
From 1913 to 2024, there have been thirteen March months with an average afternoon temperature of 23.7 degrees Celsius or more, and 13 March months with an average afternoon temperature of 21.5 degrees Celsius or less.
The nine warmest March months – in terms of average afternoon temperatures on record –in chronological order are: 1913, 1914,1916, 1938, 1968, 1981, 1998, 2005, 2010, 2013, 2019, and 2022.
In contrast, the 13 coolest March months – in terms of afternoon temperatures on record –in chronological order are: 1923, 1934,1936, 1940, 1944, 1945, 1949, 1960, 1974, 1976, 1992, 1993 and 1998.
The average afternoon temperature for March for the 48 years from 1914-1962 was 22.4 degrees Celsius, compared with an average of 22.6 degrees Celsius for the 48 years from 1963-2011.
******************************************
For further information on a range of weather and climate matters see my recent book "Climate Change: A Realistic Perspective.. The fall of the weather dice and the butterfly effect" . Available from Amazon..