|
Weather Eye with |
The climate4you.com website developed by Professor Ole Humlum who is a Danish Professor Emeritus of Physical Geography at the University of Oslo, and Adjunct Professor of Physical Geography provides many climate related graphs and analyses. The website gives current and recent data on polar temperatures..
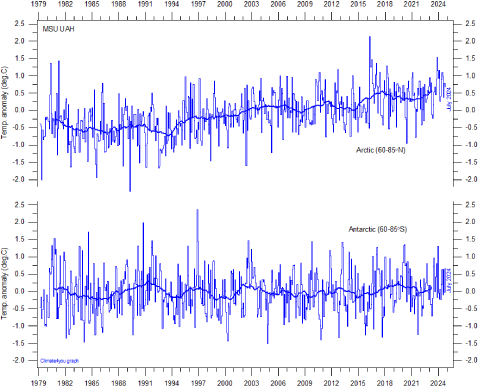
Global monthly average lower troposphere temperature since 1979 for the northern (60-82.5N) and southern (60-70S) polar regions, according to Remote Sensing Systems (RSS).
These graphs uses data obtained by the National Oceanographic and Atmospheric Administration (NOAA) TIROS-N satellite, and interpreted by Dr. Carl Mears (RSS). Thick lines are the simple running 37 month average, nearly corresponding to a running 3 yr average.
Click here for a description of RSS MSU data products.
Please note that RSS January 2011 changed from Version 3.2 to Version 3.3 of their MSU/AMSU lower tropospheric (TLT) temperature product.
Click here to read a description of the change from version 3.2 to 3.3, and previous changes. Last month shown: May 2024. Last diagram update: 22 June 2024.